
We checked 600 branded searches across 12 brands. Google wrote an answer for almost all of them. It did not always read the brand’s own website first.
553 of 600 branded searches returned an AI Overview. On reviews, prices and comparisons the figure was 99.5%. On comparison searches, the brand’s own website was cited only 49% of the time.
How we handled brand names
The 12 brands we studied are reported as codes only, such as BFSI-WK-1 or SAAS-MN-2. The first part is the industry, the middle is the brand type (WK is well known, MN is micro niche), and the number separates brands inside that group. Their own web addresses are masked everywhere.
Outside sources that Google cited, such as YouTube or Reddit, are named as found. Which outside sources Google uses is the point of the study.
Why we ran this study
For most of the time AI Overviews have existed, they turned up on one kind of search. Someone asked a general question, and Google wrote an answer. When Semrush studied 200,000 keywords that triggered AI Overviews, using data from September 2024, navigational searches made up less than 2% of the set. If someone typed a company name because they wanted that company, they usually got a normal results page.
That changed in 2026. In late September, several teams measuring AI Overviews at scale noticed the same thing within days of each other. Ahrefs, looking at 232.8 million US desktop search results, found AI Overviews on 82.91% of branded keyword results on 29 September, up from a monthly average of 61.3% in July. DemandSphere put the same day at 82.06%. Chris Long reported AI Overviews for 93 of the 100 enterprise brand names he tested. Google announced nothing.
Those studies answer one question well: how often this happens. They do not answer the question a brand owner asks next. If Google is writing an answer about my company, what is it reading? And does that change depending on what the person was actually trying to find out?
So we built a dataset to answer the second question.
What we looked at
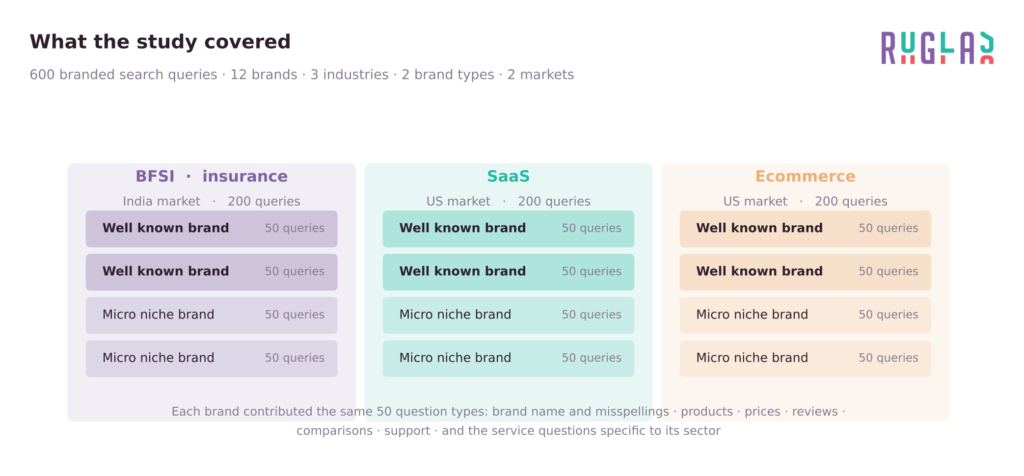
600 branded searches. 12 brands. 50 searches each. The brands were split evenly across three industries, two brand types and two markets, as the diagram shows.
Every brand contributed the same mix of question types. The brand name and its common misspellings. Products and features. Prices and rates. Reviews and reputation. Head to head comparisons. Support and contact. Plus the service questions that matter in each sector, such as claims and renewals in insurance, returns and shipping in ecommerce, and integrations and cancellations in SaaS.
That balance matters. Because every brand answers the same set of question types, we can compare question types fairly, with each brand acting as its own control. It also means our headline percentage describes this mix of question types, not how often people really search each one.
For every search we recorded three things: whether an AI Overview appeared, what it said, and every website it cited. Results were captured through a SERP API in a single pass in October 2026.
Finding 1: AI Overviews appeared on 92% of branded searches
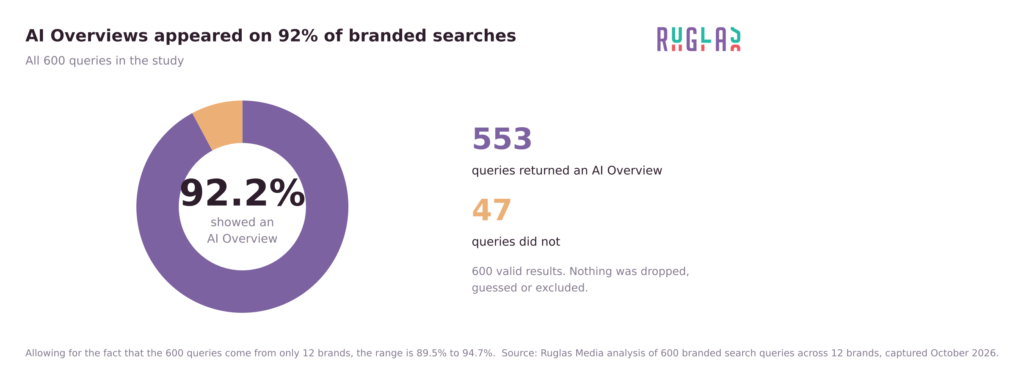
553 of the 600 searches returned an AI Overview, which is 92.2%. Because our 600 searches come from only 12 brands, we worked out the margin by resampling brands rather than searches. That gives a range of 89.5% to 94.7%.
Our figure sits a little above the Ahrefs and DemandSphere numbers, and the reason is useful. Their measurements lean towards brand name searches. Ours deliberately includes the long tail: price questions, review questions, claim questions, comparison questions. As the next finding shows, those are exactly the searches that trigger an AI Overview most reliably. Ahrefs’ own panel of 100 plain brand names returned 63%. Both numbers are right. They measure different slices of branded search.
Finding 2: What people ask matters more than how big the brand is
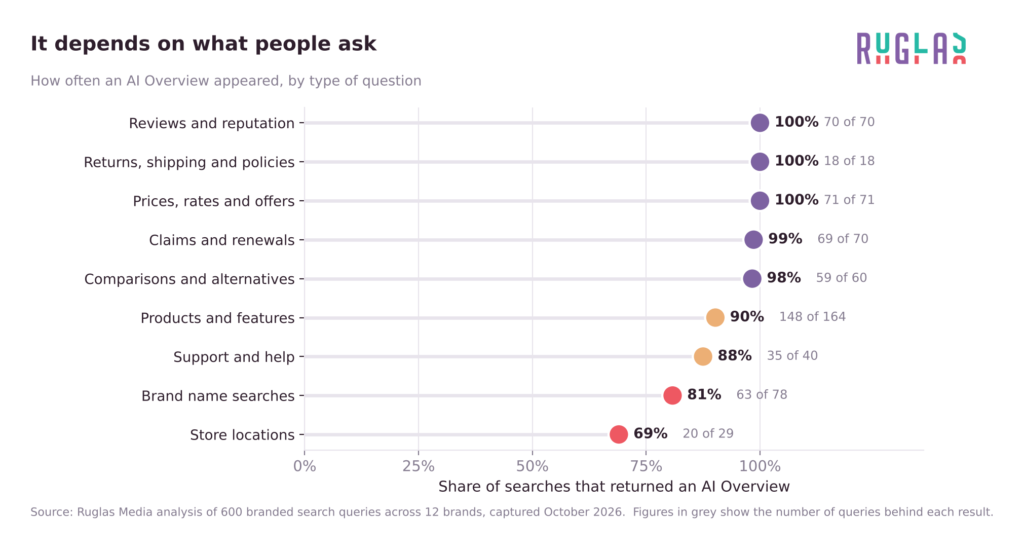
We sorted all 600 searches into nine question types, and the spread was wide. Reviews, prices and policy questions returned an AI Overview every single time. Comparisons and insurance servicing questions came close. At the other end, plain brand name searches returned one 63 times out of 78, and store location searches only 20 times out of 29.
Grouped together, reviews, price and comparison searches produced an AI Overview on 200 of 201 occasions, which is 99.5%. Brand name searches produced one 80.8% of the time.
We then checked this inside each brand rather than across pooled totals. Not one brand had a higher AI Overview rate on brand name searches than on commercial ones. Seven were lower and five were tied at 100%. Across brands, the brand name rate ranged from 33% to 100%, while the commercial rate was at or close to 100% for everyone.
Brand size told us far less.
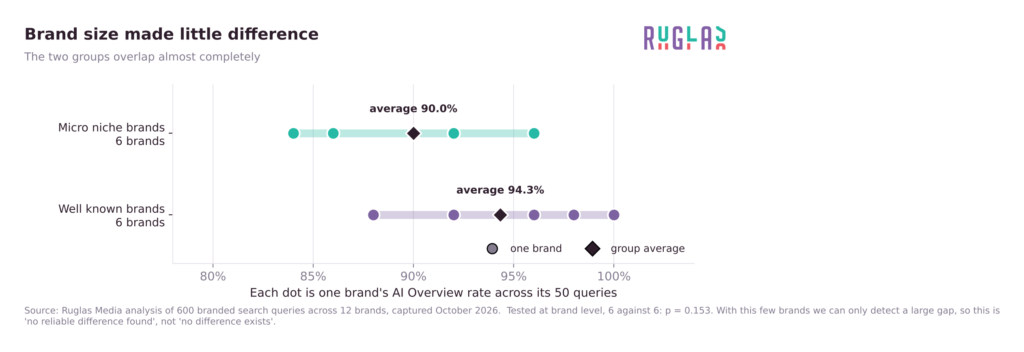
Well known brands averaged 94.3% and micro niche brands 90.0%. But the individual brand results overlap heavily, and a test at brand level returns a p value of 0.153. With six brands on each side, this study can only pick up a large difference. The honest reading is that we found no reliable difference, not that there is none.
Finding 3: Where Google answers most, it cites the brand least
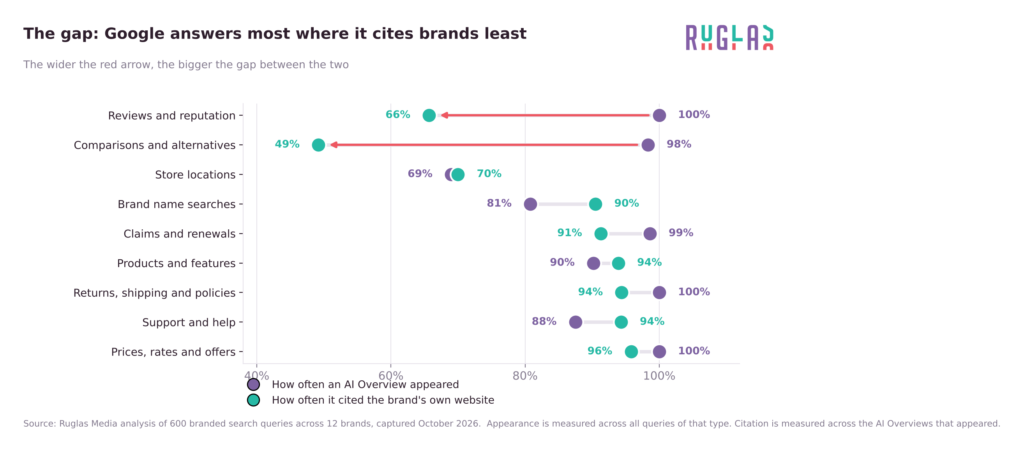
Across all 553 AI Overviews, 466 of them (84.3%) cited the brand’s own website somewhere in the sources. Split by question type, that average falls apart.
On price questions, 95.8% cited the brand’s own site. On reputation questions, 65.7%. On comparison questions, just 49.2%.
Put the two measures side by side and they run in opposite directions. The questions most likely to produce an AI Overview are the questions least likely to include the brand’s own website among the sources.
Again we tested this inside brands. 11 of the 12 cited their own site less often on reviews and comparisons than on brand name searches. The average gap was 34.7 percentage points, with a range of 13.9 to 53.5 and a p value of 0.006. For a study with 12 brands, that is about as consistent as a pattern gets.
87 AI Overviews cited no brand owned page at all. 54 of those 87 were comparison or review questions.
Finding 4: So who does Google cite instead?
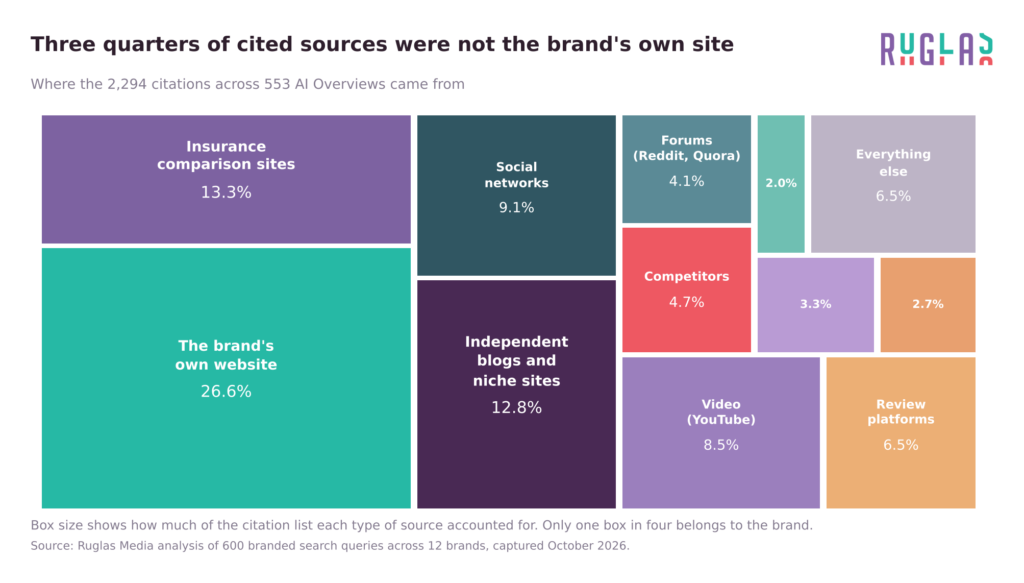
Across the 553 AI Overviews we counted 3,916 citation links, covering 2,294 unique site and search pairs, drawn from 422 different websites. A typical AI Overview carried about 7 links from about 4 different sites.
Only 26.6% of those sources belonged to the brand. The other 73.4% came from somewhere else.
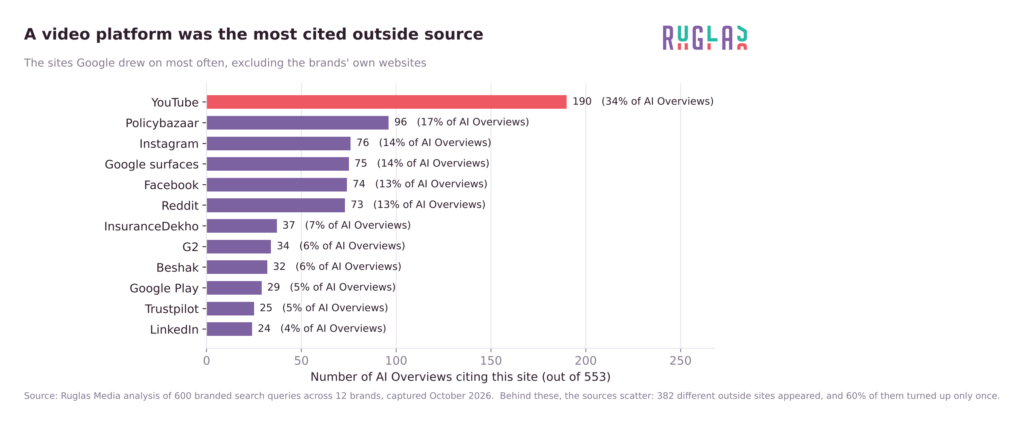
The single most cited outside source was YouTube, appearing in 190 of the 553 AI Overviews. That is more than any news site, any review platform and any encyclopedia. Social or video platforms appeared in 295 AI Overviews, which is 53.3%.
Wikipedia, by contrast, showed up in only 18 of ours (3.3%). Ahrefs found it in 71.9% of the source lists they examined. The difference is the question mix again. An encyclopedia entry answers “who is this company”. It does not answer “what does this policy cost” or “how do I return this”.
Beyond the big platforms, the sources scatter fast. We counted 382 different websites outside the 12 brands, and 60.2% of them appeared in just one AI Overview.
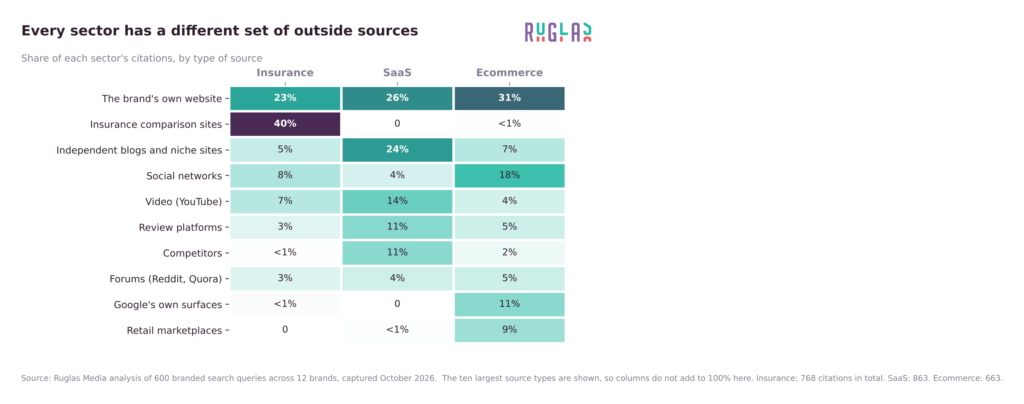
The mix also changes sharply by sector. In insurance, comparison and aggregator sites were the single biggest source type at 39.7% of citations, ahead of the brands’ own websites. In SaaS, small independent blogs and comparison sites made up 24.2%. In ecommerce, social platforms, Google’s own shopping surfaces and retail marketplaces carried most of it.
That changes what a brand can actually do. For the insurance brands, a handful of large comparison sites carry most of the weight, so checking your listing on those is a finite job. For the SaaS brands it is a long tail of small sites that no outreach programme could cover.
What this means for your brand
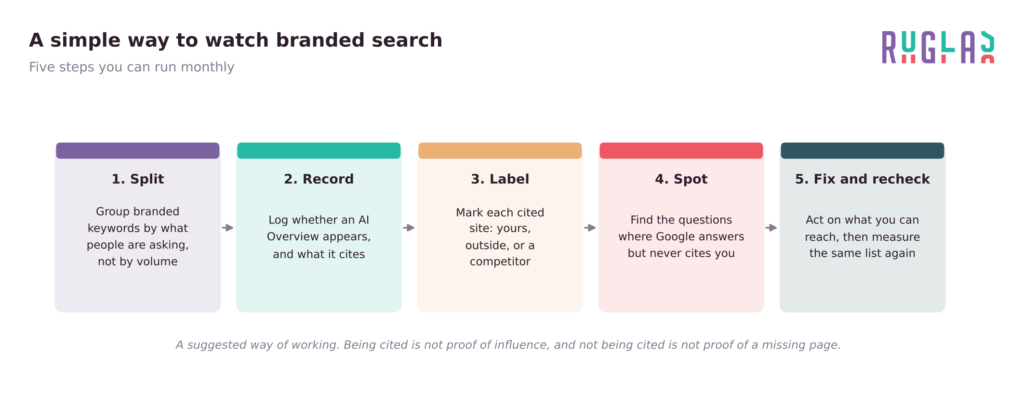
1. Split your branded keywords by question type first
One blended branded AI Overview rate hides everything. In our set the number moves from 69% to 100% depending on which slice you look at. Group them by what people are asking, not by search volume.
2. Track citations, not just appearances
Knowing an AI Overview appeared tells you 92%. Knowing whether you were cited tells you where the risk sits. The 87 searches in our set with no brand citation would be the working list.
3. Start with review and comparison searches
They trigger an AI Overview almost every time and cite you least. Read what Google actually says for your top ones and check the claims in it. Some answers we saw quoted specific performance figures about a brand, sourced entirely from third parties.
4. Fix the outside sources you can reach
Where a few large platforms carry most of your citations, make sure your listing, prices and contact details are right on those. Where it is a long tail of small sites, accept that you cannot cover it and spend the time elsewhere.
5. Keep your own facts consistent everywhere
Social and video platforms appeared in over half the AI Overviews we looked at. In ecommerce, much of that was the brand’s own social and shop presence. You control that content even though you do not own the domain.
The bigger picture: the shift has reached branded search
Step back and the pattern is easier to see.
AI Overviews started at the far end of the funnel. They answered general questions: how something works, what something means, which option suits which need. Searches where someone typed a company name because they wanted that company were barely touched. In the Semrush study of 200,000 AI Overview keywords, navigational searches were under 2% of the set.
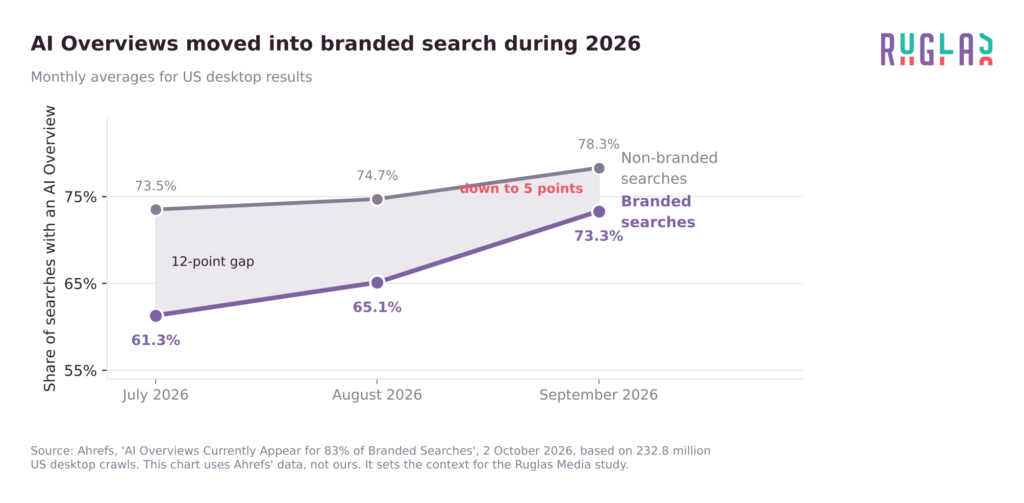
By late 2026 that boundary had moved. Ahrefs’ tracking shows branded keywords climbing from a 61.3% monthly average in July 2026 to 73.3% in September, closing most of the gap with non-branded keywords in three months. That is the shift, and it is why we ran this study.
Our data shows how far into branded search that shift has gone, and where it stops. It is almost complete at the commercial end: reviews, prices and comparisons returned an AI Overview essentially every time, for every brand, in every sector and both markets. It is least complete on plain navigation, where typing a brand name still returns an ordinary results page some of the time, and for one brand in our set, a third of the time.
So the shift is real, and it is not evenly spread. It arrived first and hardest on the branded searches that carry commercial weight, and those are the same searches where Google is least likely to be reading the brand’s own website.
Ranking first for your own name still matters. It just no longer tells you what people are reading.


